
Power BI Reporting Dashboards
Get the numbers out of your care management and finance software and onto dashboards that stay current, without someone building a spreadsheet every month.
Dashboards your team will actually use
- Link Power BI to your care management and finance software through their APIs.
- Build dashboards around what you track, for example utilisation, billing and claiming, funding, rostering, incidents or cash position.
- Set them to refresh automatically so the data is always current.
- Show your team how to read them and use them.
Built around your questions
We start with the decisions you need to make, then work back to the data, not the other way round. That keeps dashboards short, readable and used.
Signs you need it
- Reports are built by hand each month from exports.
- Different people quote different numbers for the same thing.
- Managers wait for a report instead of looking for themselves.
- You cannot easily see across your care and finance systems.
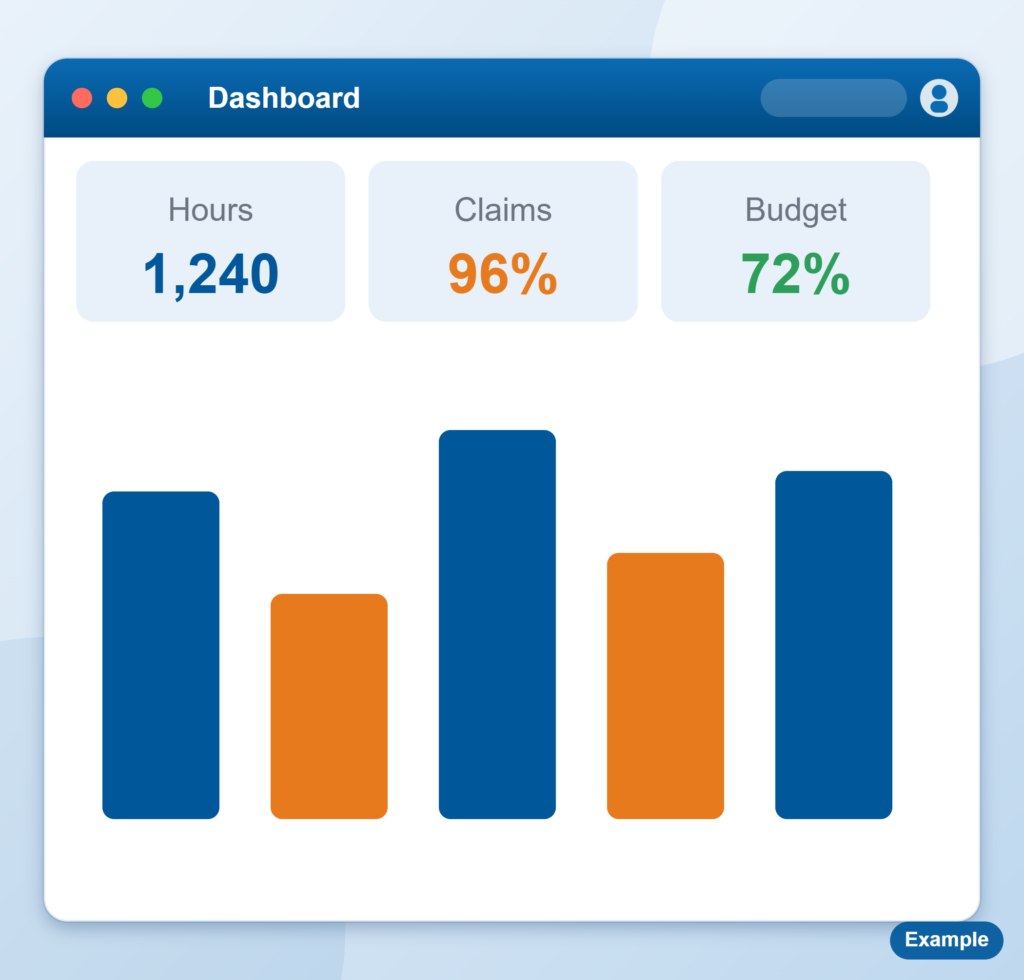
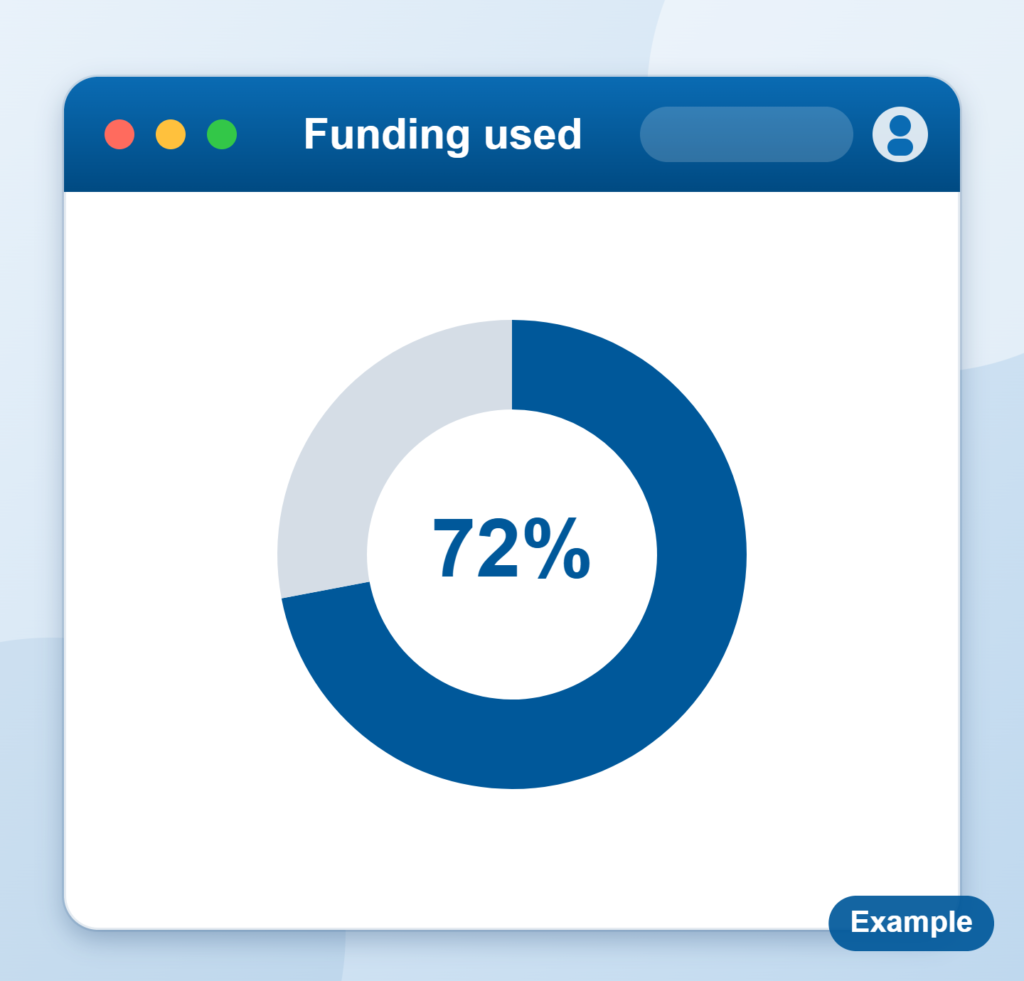
Your numbers, current and in one place
Dashboards that refresh on their own mean managers can look for themselves, instead of waiting for someone to build a report.
How it works
- Agree which questions the dashboards need to answer.
- Connect to the data and check it is accurate.
- Build a first version and review it with you.
- Adjust, go live and hand over.
What we need from you
Access to the systems the data sits in, someone who can tell us what the numbers should look like, and a short list of the questions that matter most. We check the figures against records you already trust before anything goes live.
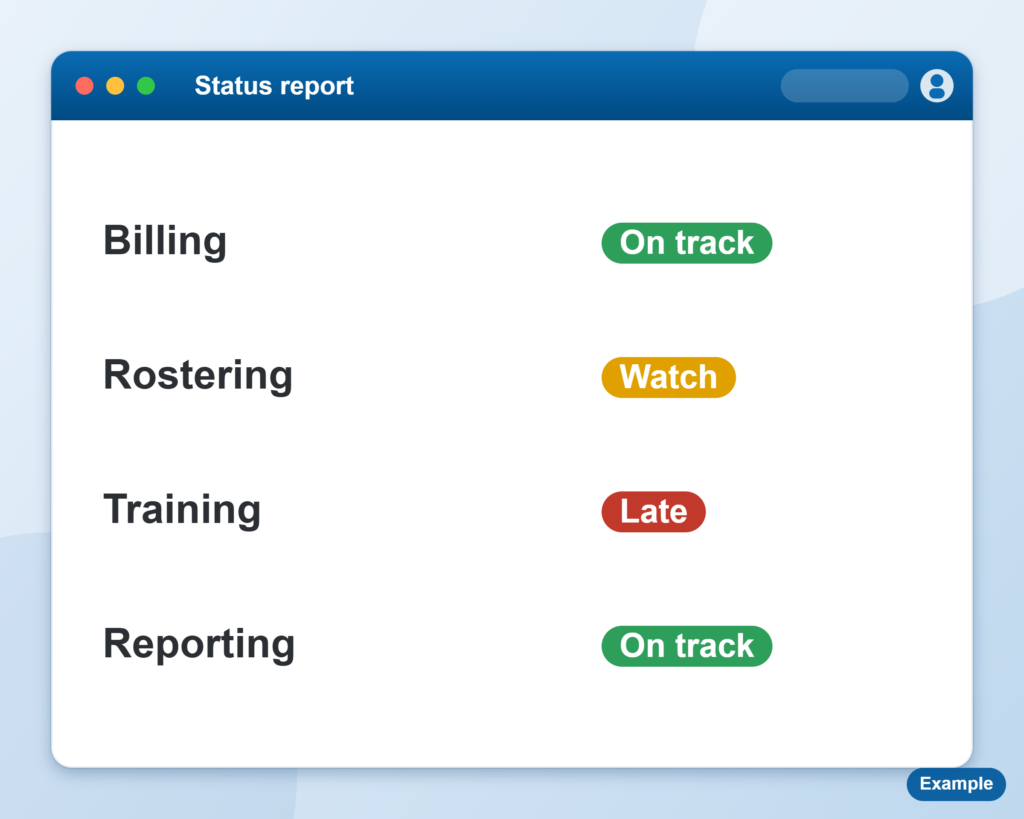
Built around your questions
We start with the decisions you need to make, then work back to the data.
Always current
Dashboards refresh on their own, so you are never working from last month.
What a dashboard can show
For example, funding used against funding available, hours delivered against rostered, invoices raised against paid, or incidents by type and month. We build around what your organisation tracks. Power BI licences are separate.
Dashboards are only as good as the data behind them. If the numbers are messy, we can tidy the source first through our data migration and audit work, so what you see is what is true. If your systems are not yet sharing data, see API connections.
What this means for you
- One version of the numbers.
- Current data, not last month.
- Less manual reporting.
- Decisions made on real figures.
- Managers who can see the position themselves, without asking for a report.
Want your numbers in one place?
Tell us what you want to see. Your first session is free.
